Home / Contents / Donations / News / Contact
OVT - Outcome Visualization
Supports:
Context:
In DAOs, there are numerous activities and operations, from project funding to developmental initiatives, each contributing to the overarching goals of the organization. However, measuring and showcasing these contributions in a manner that is easily understandable can be challenging, particularly in a decentralized environment where stakeholders may have diverse backgrounds and varying levels of involvement.
Problem:
Stakeholders often struggle to perceive the direct effects and successes of the initiatives they support, mainly due to the abstract nature of many outputs and the complexity of projects. This can lead to reduced motivation, engagement, and difficulty in making informed decisions about future resource allocations.
Forces:
- Complex Data: Projects in DAOs can generate complex and voluminous data that are hard to interpret.
- Stakeholder Diversity: DAO members may have different expertise and interests, requiring different types of outcome representation.
- Engagement Necessity: Keeping stakeholders engaged requires making outcomes tangible and understandable.
- Decision Making: Clear visualization of results aids in better decision-making for future initiatives.
Solution:
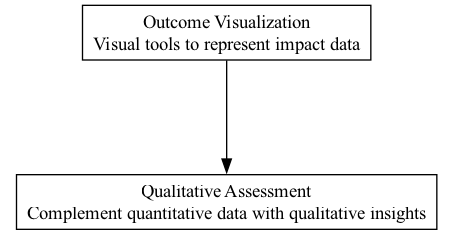
Implement a comprehensive outcome visualization system within the DAO that utilizes various tools such as dashboards, real-time data feeds, infographics, and interactive charts. These tools should represent both quantitative and qualitative impact data, turning abstract outcomes into tangible, easily digestible visuals. This can include:
- Dashboards: Create real-time dashboards that show key metrics such as funds allocation, project milestones, community engagement levels, and more.
- Infographics: Use infographics for annual or quarterly reports to highlight achievements and impact.
- Interactive Charts: Develop interactive charts that allow users to drill down into specific data points or time periods.
- Impact Maps: Design impact maps that relate specific activities to outcomes to visualize how different initiatives interlink and contribute to broader goals.
Therefore:
Integrate diverse, user-friendly visualization tools tailored to different stakeholder needs to effectively communicate project outcomes and impacts within the DAO, thereby maintaining stakeholder engagement and informed decision-making.